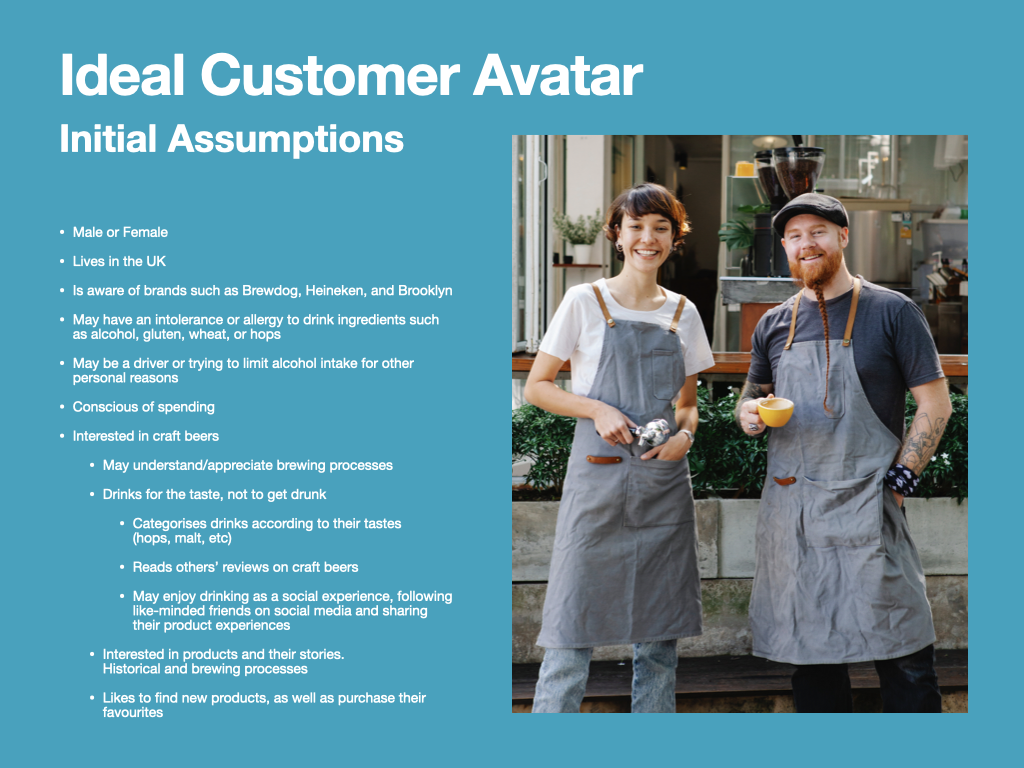
Based upon outcomes from my research, such as my competitors audit and my audit of the Sobersauce website, I have attained enough information to create some assumptions about Sobersauce’s customer base / target audience. This week, I’m presenting this information in a variety of ways including customer stories, empathy maps, and journey maps. My intention is to create two Ideal Customer Avatars / Protopersons / Personas, which will allow me to document the motivations and aspirations of the Sobersauce user base (Ferrer, n.d.).
Later, these customer assumptions will inform some of the design decisions involved with a redesign of the Sobersauce mobile experience.
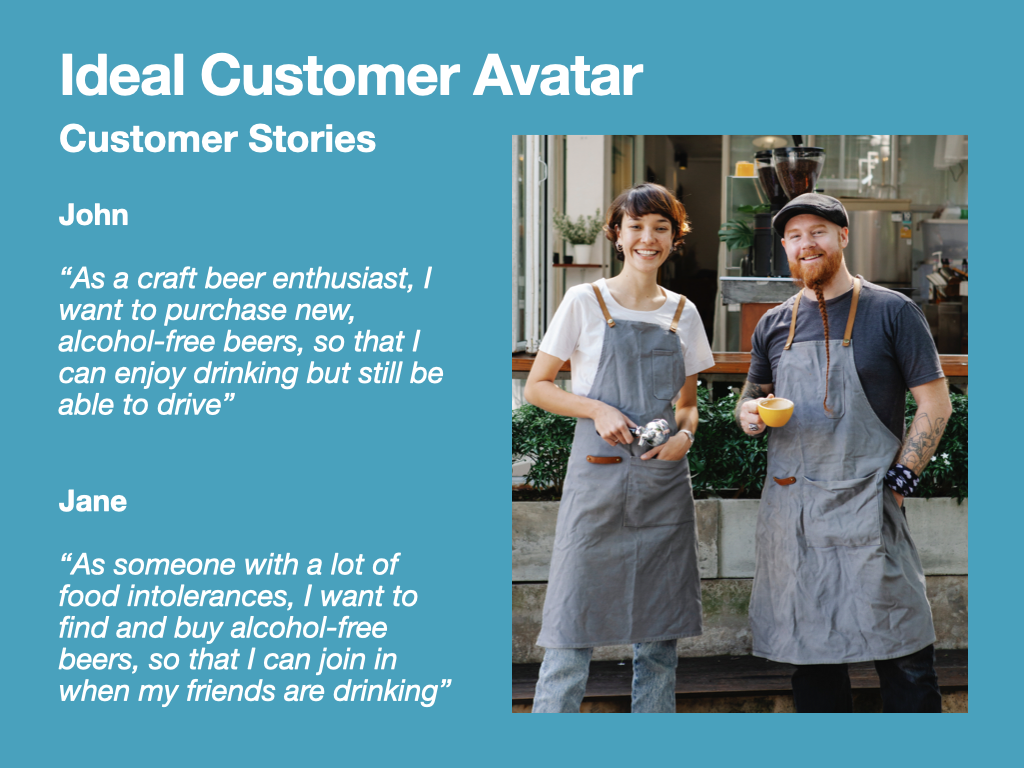
Firstly, I have written a short Customer Story for each avatar that will help me to prioritise my design decisions and empathise with these particular users needs (Ferrer, n.d.).
John is a craft beer enthusiast who would like to buy alcohol free beers that he can enjoy on evenings when he also has to drive. We also have Jane, who admits to living with a few food intolerances. For this reason, Jane would like to find a buy alcohol free beers so that she can join in with her friends are drinking.
John and Jane present two unique scenarios, and to be successful, my redesign of the Sober Sauce mobile website, should appeal to both sets of needs.
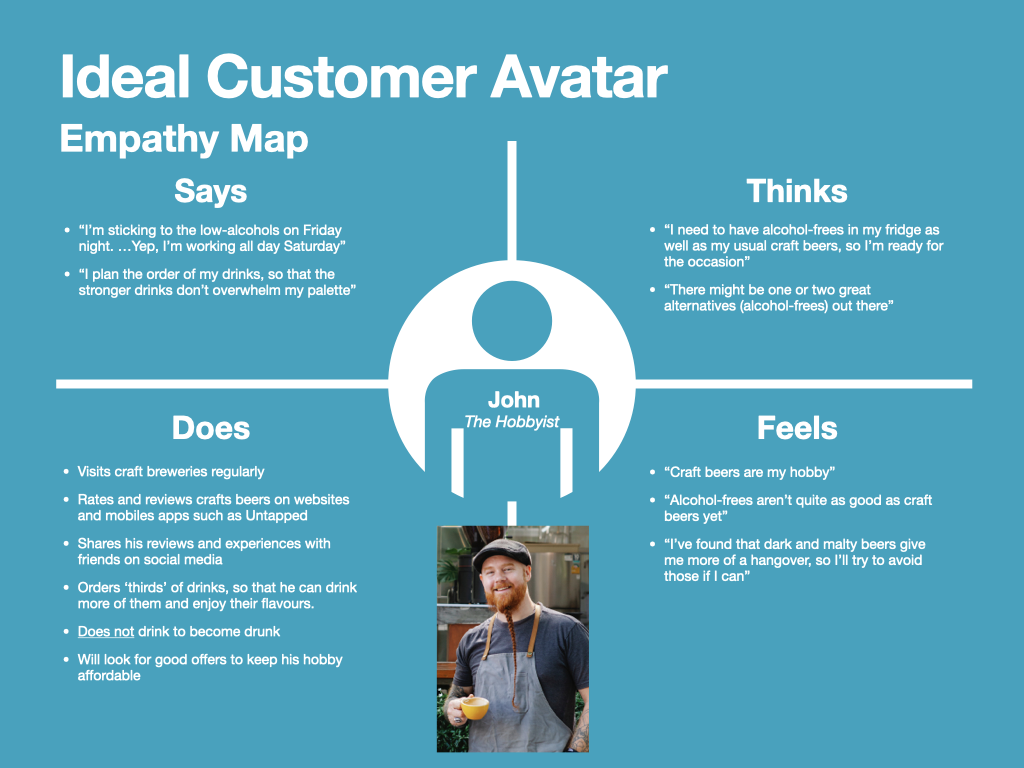
Next I decided that each Ideal Customer Avatar would require an empathy map so that I can understand what they say, think, do, and feel in relation to purchasing alcohol free beers. This is a process that I learnt during earlier module (DM7921: Design Research), which is serves as a helpful reference point when deciding how new features and functions of prototypes may be received by the customer.
John loves his craft beers. He believes that they are hobby of his, and looks forward to attending craft breweries and trying the latest offerings. He will regularly review craft beers on websites and apps, browsing other reviews and sharing his own on social media. He doesn’t mind drinking alcohol frees, especially when he needs to be driving on the following day. However, he feels that alcohol-free craft beers are not as good as ‘the real thing’. John also has some reservations about ingredients in craft beers, as he thinks they give him stronger hangovers.
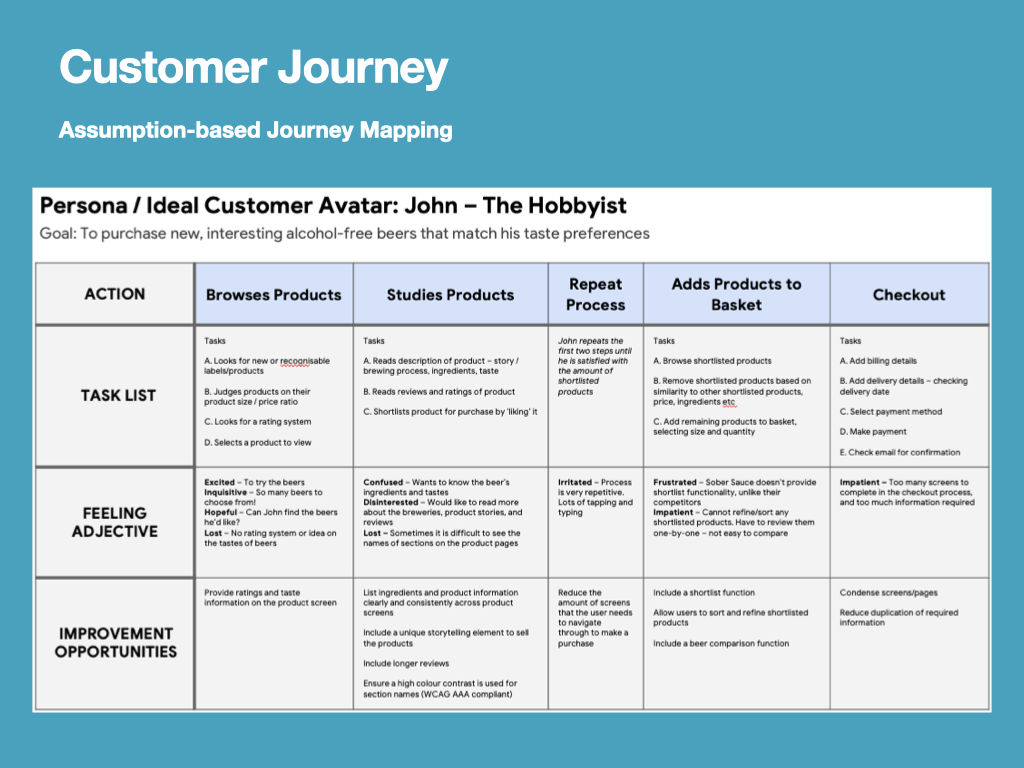
Once I had developed a thorough understanding of John and his preferences towards purchasing alcohol-free beers, I could focus on illustrating his purchase journey.
A journey map like the one on screen depicts how the customer achieves a specific goal. In this scenario I can review all of the steps required to achieve that goal, such as buying alcohol free beer, and consider any pain points that may occur on the way. There is also space for me to note how I could improve upon those pain points. On screen I have used a template for a journey map, produced by Google. By using templates I can make sure that I am working to an industry-accepted standard, which is rigorous-enough for the requirements to redesigning the UX of a website.
Another good reason for creating journey maps is that it can help me avoid designer bias… This is where the designer (me) designed the website for my needs rather than the needs of the intended audience (John and Jane). Every design-based decision should be considered from the point of view of the Ideal Customer Avatar, the customer story, empathy map, and customer journey map.
So, looking at John’s customer journey map, I can see there are a few situations whereby he becomes irritated or frustrated. For example, he is irritated by the repetitive nature of adding products into his shortlist or basket. I’ve also noted that there is an opportunity to improve this by reducing the amount of screens that need to be navigated in this process.
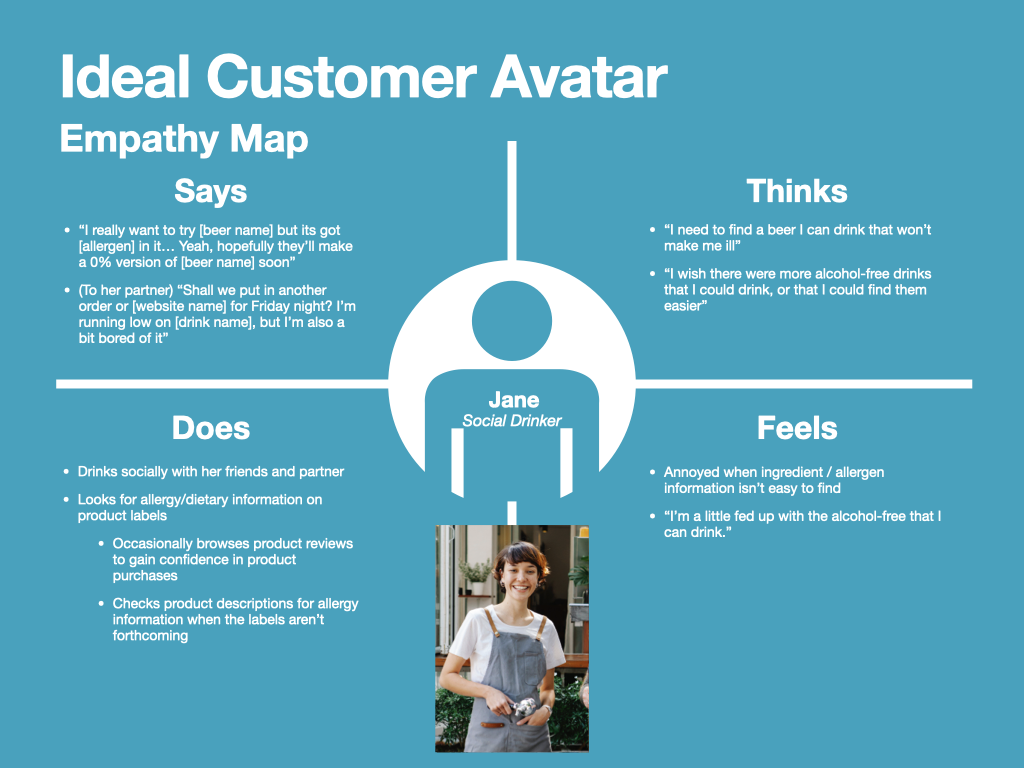
Secondly, we have Jane. Jane is a social drinker and so enjoys her alcohol-free drinks as a social experience. She has an undisclosed intolerance to an ingredient frequently used in craft beer making. For this reason she is intent on reading information about drinks before she purchases them, and can become irritated when the information is not easy to find. She finds that a lack of drink variety due to her intolerance can be limiting (and perhaps avoidable if ingredients were labelled properly), and so gets bored of her drinks.
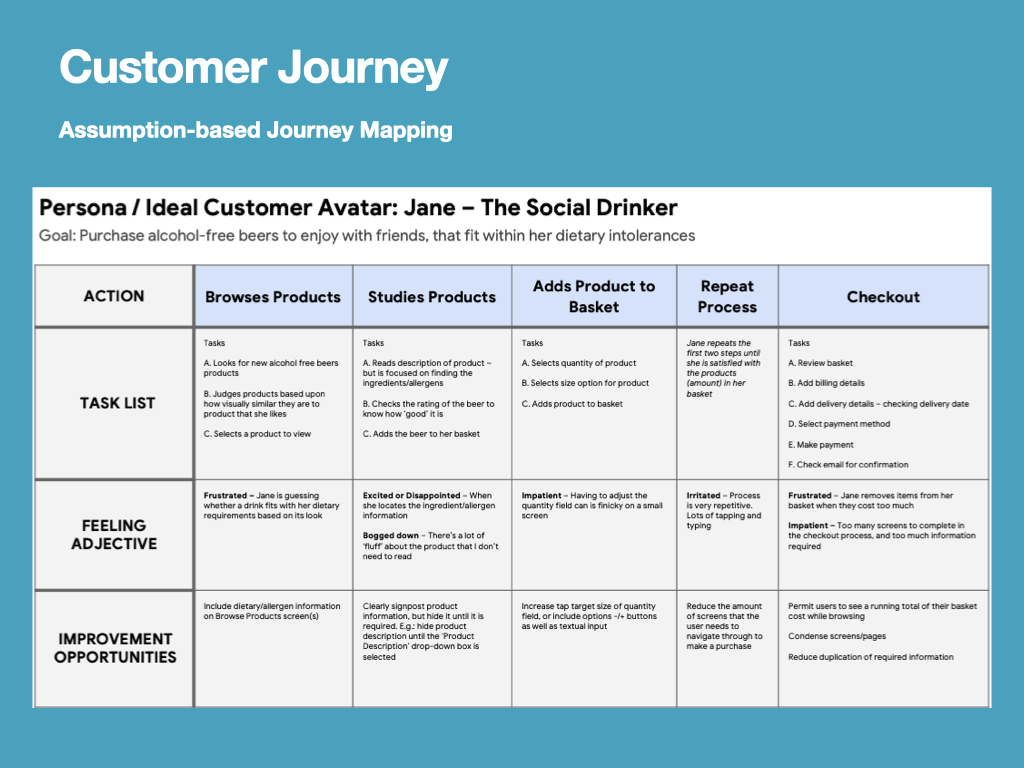
Jane’s customer journey map places a little more emphasis upon the availability of information on the Sober Sauce website. The information architecture makes dietary and allergen information difficult to find, especially considering that there is information about the product that Jane does not want to see. This is somewhat conflicting Johns preferences, as he would like to learn as much as possible about the products before he purchases them. This conflict presents an interesting challenge for me I will need to consider in the latest design phases of this project.
However, we can see that Jane becomes impatient and frustrated in the same way that Jon does, when they experience repetitive processes such as adding products to the basket and completing the required information in the checkout process. Finding these agreements/similarities allows me to be confident in prioritising the remedial work on these issues above others.
A downloadable version of the Journey Maps is available here:
References
Ferrer, M. (n.d.). Online Course – Introduction to UX Writing (Mario Ferrer). [online] Domestika. Available at: https://www.domestika.org/en/courses/798-introduction-to-ux-writing [Accessed 28 Feb. 2022].